A quick intro to the Phase Diagram
Phase Diagrams are graphic representations that help understand many physical systems such as magnets and pure substances like water. These diagrams also help us understand how dense droplets of biomolecules, called Biomolecular Condensates, form inside cells. Phase Diagrams predict under which conditions these condensates can form and also what will be their molecular concentration. Watch this quick intro to learn more! References: -Video C. Elegans: Fritsch, Diaz-Delgadillo, Adame-Arana et al., PNAS (2021) https://www.pnas.org/doi/10.1073/pnas... -Multicomponent Phase Diagram: Bauerman, Laha, McCall, and Weber JACS (2022) https://pubs.acs.org/doi/pdf/10.1021/...
Prepared by Mariona Esquerda Ciutat from the Hyman and Jülicher labs in Dresden.
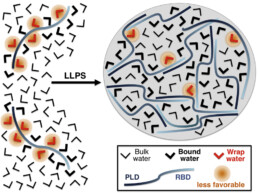
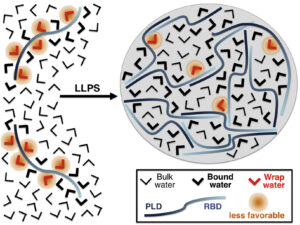
The key role of solvent in condensation: Mapping water in liquid-liquid phase-separated FUS
What drives the formation of biomolecular condensates from proteins in water? The Adams group, in collaboration with colleagues from Ruhr-University Bochum, Germany, measured the thermodynamic forces leading to the expulsion of water from condensates as they form through protein-protein interactions. the results are published in the Biophysical Journal. Read more.
CBG Postdoc Program
To apply for a postdoc position at MPI-CBG in Dresden, contact CBG group leaders or visit the vacancies page of the MPI-CBG Dresden.